


Functionality
Focusing on service
Netgraph
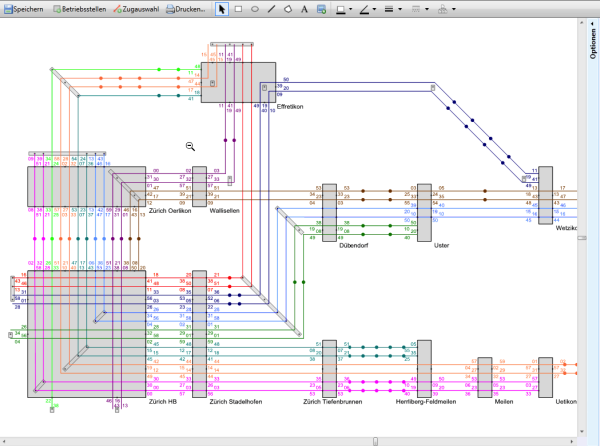
The introduction of coordinated (“interval”) timetables has led to the ability to represent timetables in a way that shows both the geographical network and the train times in an efficient manner on a “netgraph”. A single line represents each service (and the corresponding journey in the reverse direction) connecting the stations it passes through on its trip, with the arrival and departure times for each station indicated. The cyclical aspect of the timetable means that a whole repeating family of trains can be covered by one line on the diagram.
The connection times between services at a station can be seen at a glance, giving a powerful method for improving the coordination between services for the train planner.
Viriato was the first planning tool to successfully combine this netgraph with graphic and tabular timetables to produce a single integrated planning tool.
Visualise capacity
Graphic timetable
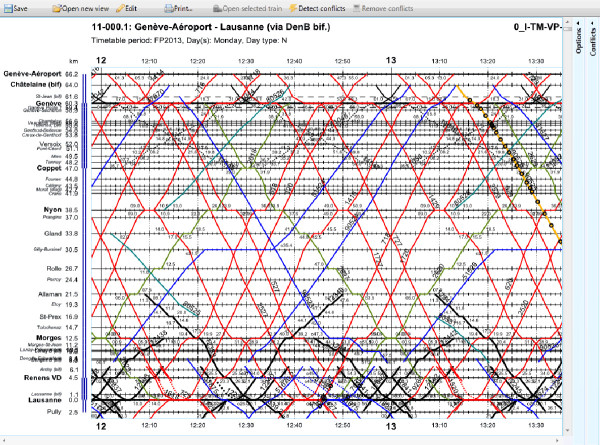
Graphic timetables represent train operations and are pivotal when determining the interactions between trains at a network-wide level. Graphic timetables can also be used to identify the likely rolling stock requirements for a line and produce initial utilisation plans.
An experienced timetable planner can assess the feasibility of a timetable and the plan, such as insufficient headways between services or conflicting movements over a single track section simply by looking at a graphic timetable
Viriato’s highly configurable graphic timetable functionality allows users to represent the trains according to their needs. For example, colours may indicate different train types (e.g. by service group or line), while line thickness may reflect express or regional service. Such customisation gives timetable planners the power to produce highly descriptive graphical timetables, and to identify timetable improvements.
Production facts and figures
Customer Timetable
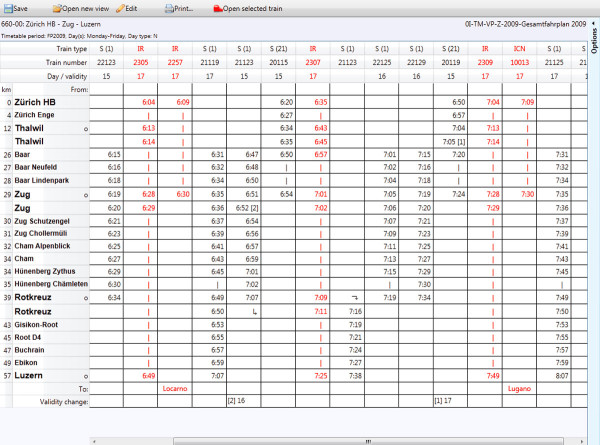
Timetables form a clear description of the service in terms of product type, coverage, frequency and/ or station calling pattern policy, and are thus indispensable.
The customer timetable is the traditional method for presenting the schedule of trains along a route. The functional requirements for a customer timetable vary depending on how it will be used. Used in conjunction with the operational modules, such as the graphic timetable, it provides further insights into aspects of the timetable on rail traffic.
Viriato provides flexible filter possibilities and layout settings that permit users to easily display the desired information. Viriato also provides an interface that allows customer timetable data to be analysed and/or displayed using MS Excel.
The connection clock shows graphically the relationship between arriving and departing services at a station so that the timetable planner can efficiently manage the arrival and departure times. This maximises the connection possibilities for customers so that as many potential journey combinations as possible become practical for travellers. The arrival and departure times of services are shown in the form of a clock arranged around the node allowing this information to be absorbed in a glance. The user can also display the usage of specific platforms during the hour.
Switzerland’s official running times supplier
Running time calculator
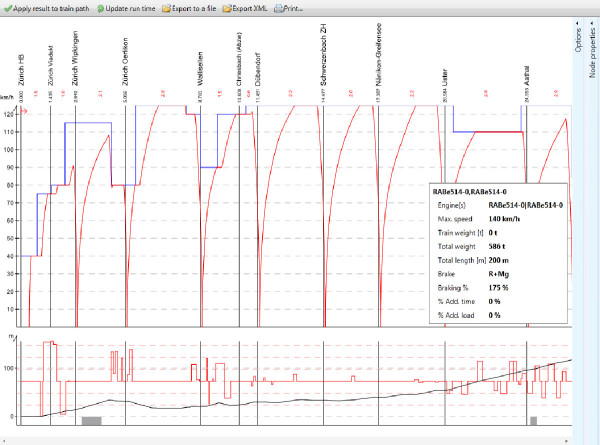
Accurate train planning requires a detailed knowledge of a train’s technically feasible running time. The ability to dynamically recalculate the running time during the planning process is essential. This allows changes in rolling stock and infrastructure, such as temporary speed restrictions for engineering works, to be included in the timetable. Viriato makes it possible to calculate precise running times based on a wide range of technical and operational parameters.
The running time calculator in Viriato includes the algorithm used by Swiss Federal Railways (SBB) and by Infrabel to calculate all their running times in Switzerland and Belgium. This calculator allows an unlimited combination of rolling stock types, traction values, dynamic resistances and braking curves to produce highly accurate running times which have been validated by SBB during their daily operations.
The civil engineering characteristics of the infrastructure such as gradients, curvature and speed restrictions are entered to produce a highly detailed model of the railway.
The Viriato running time calculator allows users to easily define their own rolling stock types with associated performance characteristics.
The Viriato running time calculator integrates fully into the train planning process, and the results are instantly reflected in a train’s running times.
Round and round they go
Vehicle rostering
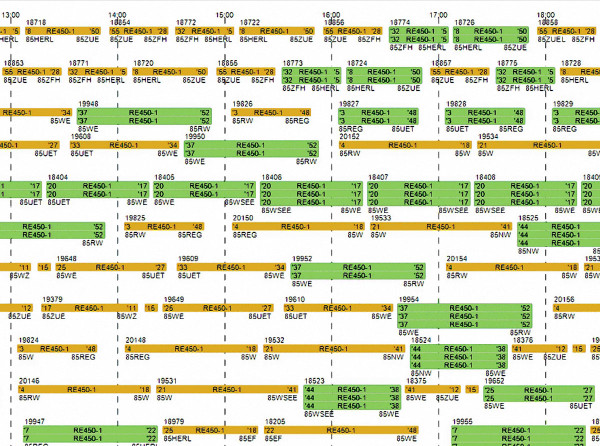
The planning of efficient vehicle rosters is a key activity affecting the economic performance of a railway. The capital cost of rolling stock is high, and the challenges of meeting the service commitment to passengers and customers, while retaining sufficient margin for maintenance activities requires a coordinated planning approach.
The Viriato Vehicle Rostering module is designed to be fully integrated with the timetabling functionality of Viriato, allowing the creation of vehicle rosters during the planning process.
Throughout the life cycle of a timetable there are different requirements for vehicle rostering, and the Viriato Vehicle Rostering module provides the functionality for this entire process.
During the initial long term strategic planning process the user can concentrate on determining the size of the required rolling stock fleet to deliver the service pattern. As more detail becomes available the vehicle rosters can be refined to include detailed rolling stock information, maintenance activities and empty runs.
Keeping track
Platform occupancy
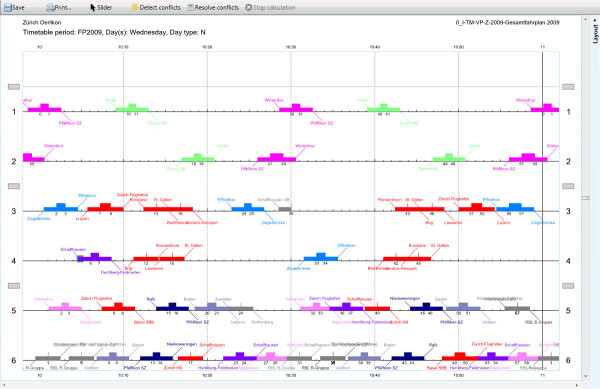
Stations are at the heart of railway operations. Here lines converge, trains arrive and depart, passengers come and go and change trains, and trains are taken out of service, cleaned and maintained. As train operators introduce regular interval timetables and develop major connection points, the operational functions and capacity requirements placed on stations increase significantly.
Given these conditions, every step must be planned in detail. Therefore the analysis of arrival/departure times, the allocation of platforms and their occupancy is a core part of the timetable production process. The questions that are addressed in this analysis include: Are there sufficient platforms available for the proposed service concept? And what additional tracks or switches are needed to increase the service?
Viriato’s platform occupancy module provides timetable planners with a simple and powerful tool for planning, evaluating and producing platform occupation charts. The planner can drag and drop trains between platforms and review conflicting moves instantly.
Viriato can help the timetable planner to create conflict-free platform workings with the optional conflict detection module displaying planning rule violations and conflicts between services on a given track or between arriving and departing trains from different tracks within the station area.
The dark side of capacity
Conflict detection
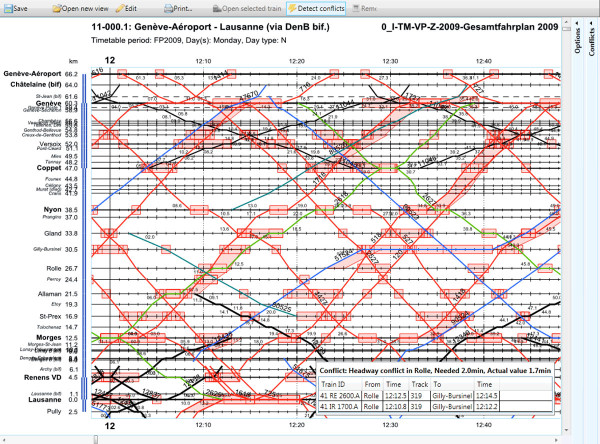
A railway timetable is subject to numerous constraints, including those due to infrastructure (line headways, interlocking systems, etc.), vehicles (performance, train type, etc.) and the service pattern (intermediate stops, connections, etc.). The higher the railway system’s degree of complexity, and the closer to operating at design capacity, the more these constraints must be considered in timetable planning.
In complex cases it can be very difficult to verify that all the constraints on operation have been considered and that the proposed timetable remains conflict-free.
Viriato’s conflict detection module rapidly determines and visualises all conflicts on the graphic timetable. The user can alter a planned train by dragging the path on the graphic timetable, and any remaining conflicts are instantly shown. Viriato produces a tabular summary of conflicts and durations to enable the planner to resolve them quickly.
The Viriato conflict detection module also detects platform allocation issues. Our rigorous mathematical algorithm detects conflicts within a platform occupation plan, and alerts the user if the proposed service pattern is infeasible, providing a valuable early warning to the train planner.
Getting there
Trip time analysis
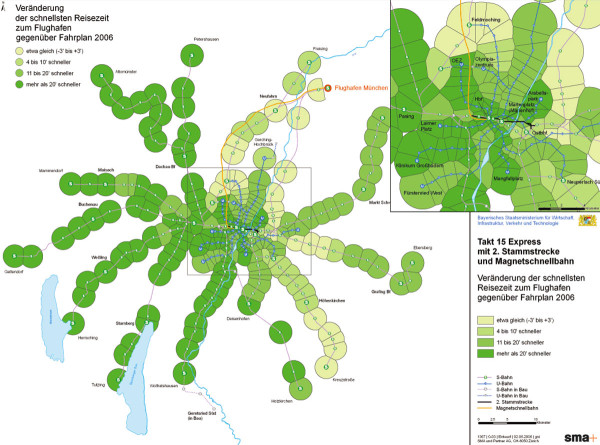
Timetable production is an interactive process involving many constraints and conflicting goals. Operational constraints often have impacts that are not initially obvious. Furthermore, the system-wide impacts of local timetable changes are not directly evident in large railway networks.
Viriato’s trip time analysis module enables timetable planners to compare alternative timetables and analyse timetable and service quality. It starts by identifying all meaningful connections based on the timetable data, trip times and user-defined transfer times. Once the connections have been identified, Viriato calculates the alternative’s most important customer and operational qualities.
The trip time analysis module provides many different analysis tools enabling timetable planners to thoroughly evaluate alternative timetables, and permitting the attractive presentation of this data in a variety of graphical formats. This allows the travel opportunities offered by the new timetable to the railway and its customers to be communicated effectively.
Understanding passenger flows
Demand assignment
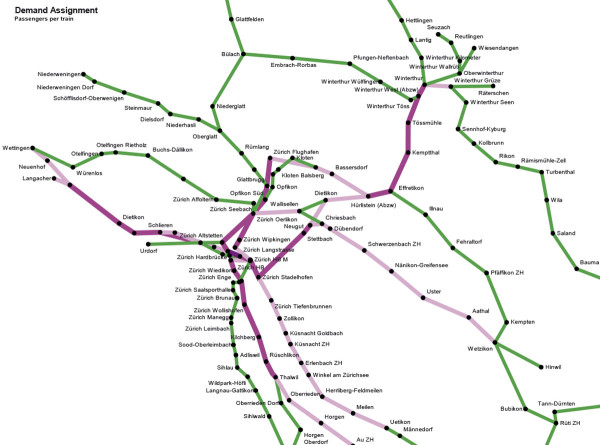
The creation of a new timetable and service often influences the choice of route taken by passengers. The Viriato add-on module trip time analysis calculates the routes that can be taken by passengers, including changing trains and indicates any change of service quality between timetables. The Demand Assignment module goes one step further, as it incorporates the passenger demand into trip time analysis and thus allows the determination of the number of passengers travelling on each train in the timetable.
An iterative process is carried out within Viriato which makes transparent to the user the interaction between new timetable service concepts and the associated changes in passenger routing and flows. Within this process occurs the timetable concept creation itself, calculation of the possible connections available, apportionment of the passenger demand on the new routes and thus the loading of trains. As the user modifies the timetable concept this process repeats. This analysis is all undertaken within Viriato using the Trip Time Analysis and Demand Assignment add-on modules.
The algorithm for passenger assignment uses an analogy with the flow of electrical current based on the principle of simultaneous apportionment to calculate routing and loads. The demand from every origin-destination pair is simultaneously distributed to trains based on the relative “resistance” experienced for each choice, i.e. the attractiveness to passengers of each possible journey is calculated based on the travel time and number of connections required.
Viriato also calculates the distribution curves containing the fraction of passengers who wish to travel each hour used by the module based on known travel patterns between locations, allowing the modelling of morning and evening peaks, flows into major conurbations, etc.
Dealing with uncertainty
Robustness analysis
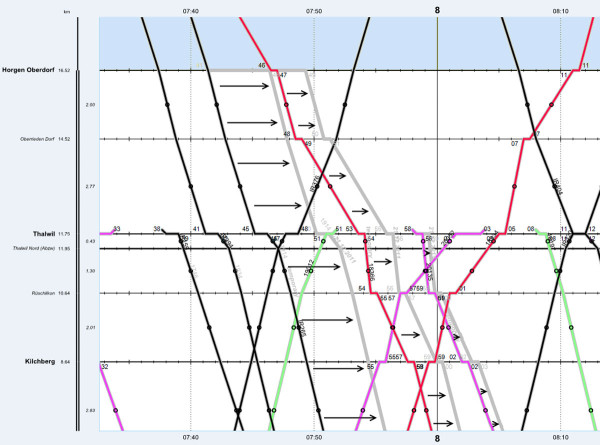
In the iterative process of timetable production, evaluation of plans plays an important role. One aspect which is usually especially hard to quantify and assess is the operational robustness of a timetable variant. The determination of the impact of local infrastructure or timetable changes on the robustness of the whole system is a difficult task even for experienced planners when working with large networks.
The robustness analysis module allows the validation of the stability of a timetable and the comparison of the performance of alternative timetables. The user develops delay scenarios containing a set of pre-defined incidents that they wish to test a timetable against, including possessions. This is then processed by Viriato using the infrastructure data, with the original delays propagated through the timetable until the service pattern returns to normal. The calcualtion can be applied either to a single case, or as part of a Monte Carlo simulation to understand the robustness over a range of incidents. Once the calculation is done Viriato produces statistics and the perturbed timetable can be saved as a regular Viriato scenario.
The result of the delay propagation may be reviewed using Viriato, and includes statistics such as the duration for recovery and the total delay minutes due to the original perturbation. These statistics can be exported and used for further analysis and for the presentation of results. Results saved in a new timetable scenario can be displayed and analysed using all the standard Viriato functions. This allows the robustness of any new timetable to be effectively analysed and easily communicated.
Keeping the railway running
Works planning
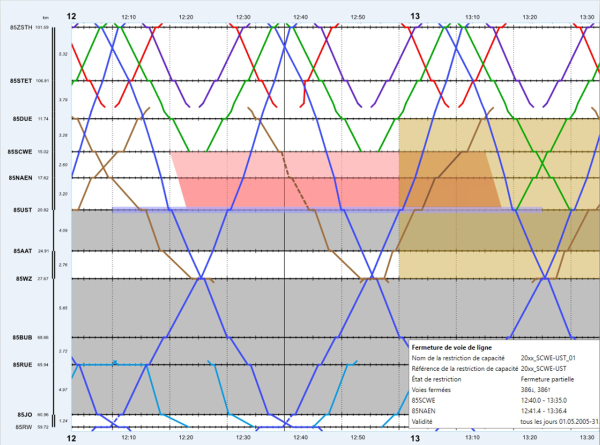
Although the key reason for running a railway is moving passengers and goods, it should not be forgotten that there is the requirement to maintain and upgrade the infrastructure to allow operations to continue and grow. Without maintenance work, the condition of railway assets soon begins to degrade.
While Infrastructure Managers try to minimise the effects of these engineering works on their customers, they often have consequences to planned trains which may require modification to allow them to run on days with works. Train operators need to know which tracks are available between stations, within stations them selves, and will there be any additional running time due to speed restrictions?
The works planning module allows the creation of the engineering works, and the display of the interactions with planned trains. The engineering works can be collected together through the use of scenarios, allowing the user to group and filter subsets of the works based on their own criterion. It is also possible to import and export engineering works using the standard TCR format for exchange with other systems.
The engineering works can be visualised in the graphic timetable within Viriato, allowing an immediate overview of trains which are planned to run through track sections which are closed, or have a speed restriction planned. A report can be created that shows in detail exactly which trains are affected on each date during the timetable period, allowing them to be identified and replanned for the affected dates.
Taking platform thinking further
Interfaces
A train timetable goes through many planning stages over its long period of development. The process starts with the preparation of a draft service plan. This is constantly refined until operations of the train commence. Finally, after the introduction of the timetable system performance is analysed. Finding the timetable that best balances the railway’s operational and economic needs requires much iteration.
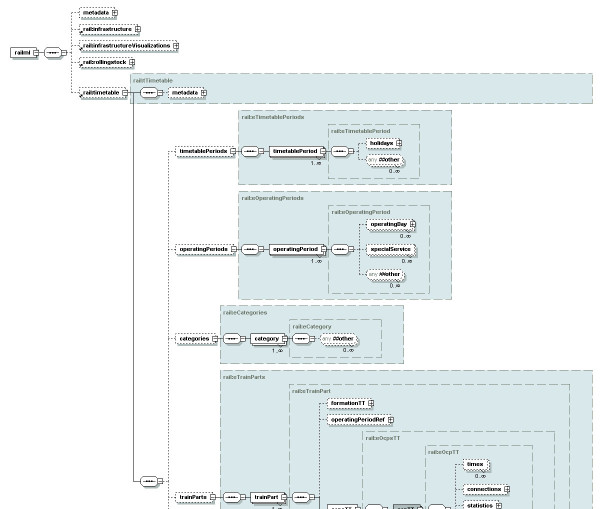
Viriato’s versatility enables it to support timetable planners at all stages of the development process. Nevertheless data will almost certainly need to be exchanged with other applications at some point in the process, and used either in parallel or sequentially. A central element in the data exchange process is insuring efficient data flow without wasteful and error-prone re-collection of data. The challenge consists of linking different applications over intelligent and standardised interfaces.
The railML initiative was created to improve the data exchange process between railway information technology applications (www.railML.org) through the development of agreed standards. SMA und Partner AG was a founding member of the railML initiative and continues to actively participate in railML development. The goal of railML is to link different applications through the creation of defined interfaces between diverse rail service planning and operations IT applications, and to simplify information exchange with the definition of standardised XML-based schemas.
For exporting data to customer facing systems, Viriato includes a GTFS format export and an optional export to NeTEx (currently limited to the Swiss implementation) is also available. There is also an optional module for exporting timetable data to IVU.rail.
For analysing data produced in Viriato in 3rd party systems, an XML reporting export is included which includes timetable and associated base data enabling detailed queries and post-processing to be undertaken.
Path Search
Path Search
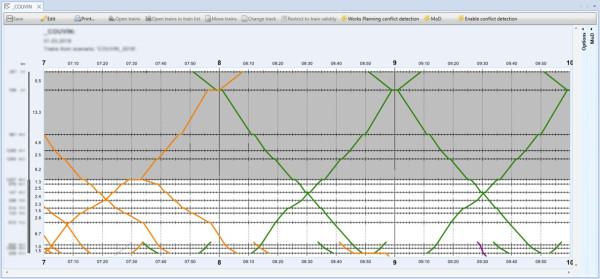
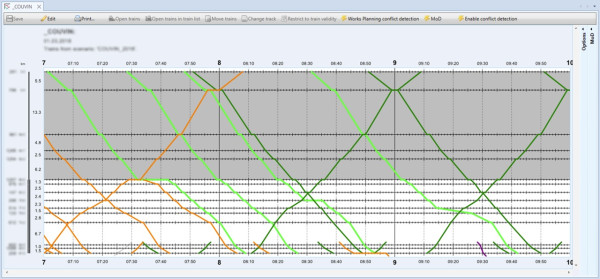
Viriato Path Search is a module that automatically generates and inserts conflict-free train paths within an existing timetable. Using an existing train as a template, Viriato searches for feasible timings that satisfy infrastructure constraints, headway rules, and separation requirements while minimising deviation from the desired operating pattern.
The mathematical module is based on Mixed Integer Linear Programming (MILP) and can be used for timetable development, capacity analysis, and the assessment of residual network capacity. A Gurobi solver licence is required.
Microscopy-on-Demand
Microscopy-on-Demand
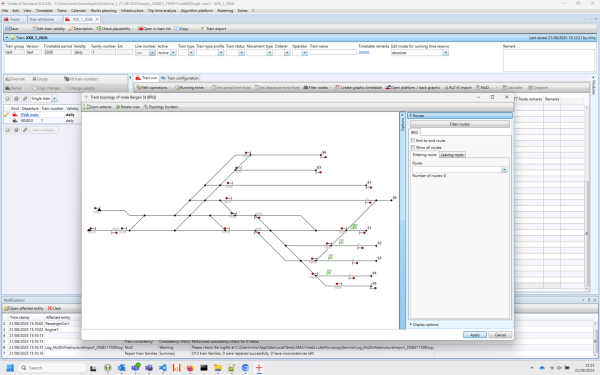
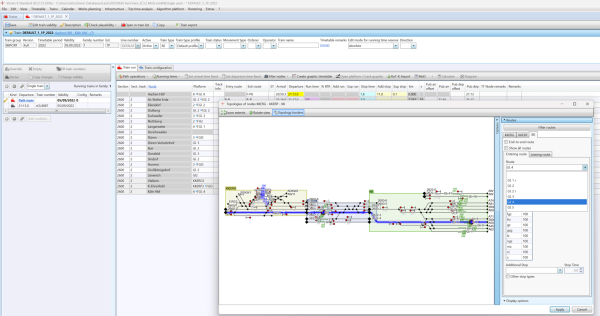
Microscopy-on-Demand (“MoD”) refers to a conceptual software architecture that SMA has developed over the last few years. This concept makes it possible to switch easily between the macroscopic and the microscopic (i.e. highly detailed) model at all stages of the planning process. The basic tasks of planning the offer, design, verification of the driveability (including running time, occupancy calculation and conflict detection) and analysis of an existing conceptual offer (i.e. stability, capacity utilisation, vehicle circulation, etc.) can now be carried out using MoD with the most appropriate tool. Through the use of external routing, running time and conflict detection services from third party tools, the benefits of both efficiency and accuracy in timetable planning can be achieved for the user within Viriato. There now exists full MoD implementations for national microscopic systems for Germany and France, and with a country-independent system for infrastructure and routing.
Network Capacity Analysis
Network Capacity Analysis
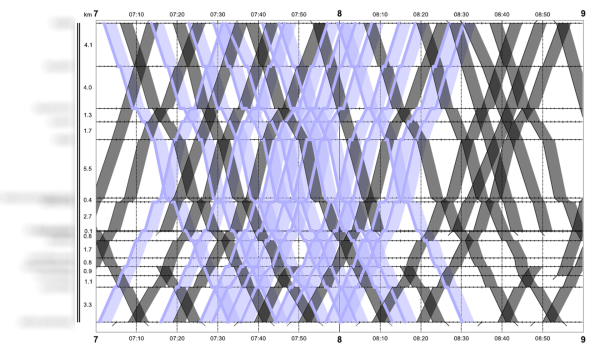
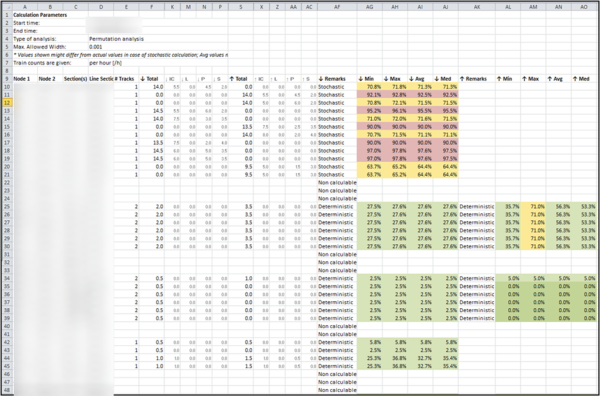
An important ability in planning a timetable is to understand how much capacity is remaining so that there is sufficient for the timetable to operate, without having too much wasted by being unused. The Network Capacity Analysis module contains several algorithms for determining the amount of capacity used in a given timetable intention.
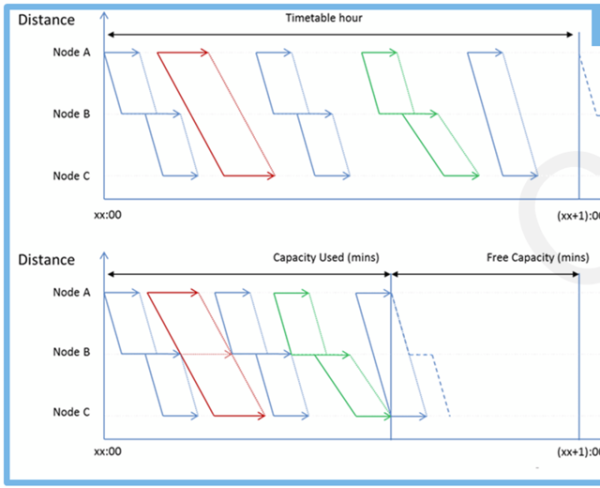
The first is the Practical Capacity approach. This is a timetable compression algorithm where the planned services are pushed as close together as possible without violating headway and separation times over a defined section or node, giving a direct measure of how much capacity has been used. For example it may be shown that one hour's worth of services could be delivered in 45 minutes, so this timetable has a potential capacity utilisation of 75%.
The second method is the calculation of the Residual Capacity. In this method, the existing timetable is kept fixed, and additional trains are inserted into the plan until no more services can be added. At this point the timetable is said to be “saturated” and the planner then knows the theoretical limit of additional trains that can be run. A Gurobi solver licence is required for this algorithm.
Both methods provide detailed reports showing the details of the capacity that remains available in the timetable.